Read your server's traffic graph in the client area
See your dedicated server or colocation traffic in the CR Servers client area: where the graph is, how to read it and what the numbers mean.
Your dedicated server or colocation equipment connects to a port on one of our switches. We measure the traffic on that port every 5 minutes and show it in the client area as a graph.
Open the graph
- In the client area, under Your services, click your service type, then Manage on the server.
- Open the Graphs tab.
- Choose 24 hours, 7 days or 30 days. For other dates, fill in From and To, then click Show.
Times on the graph are Costa Rica time (UTC−6).
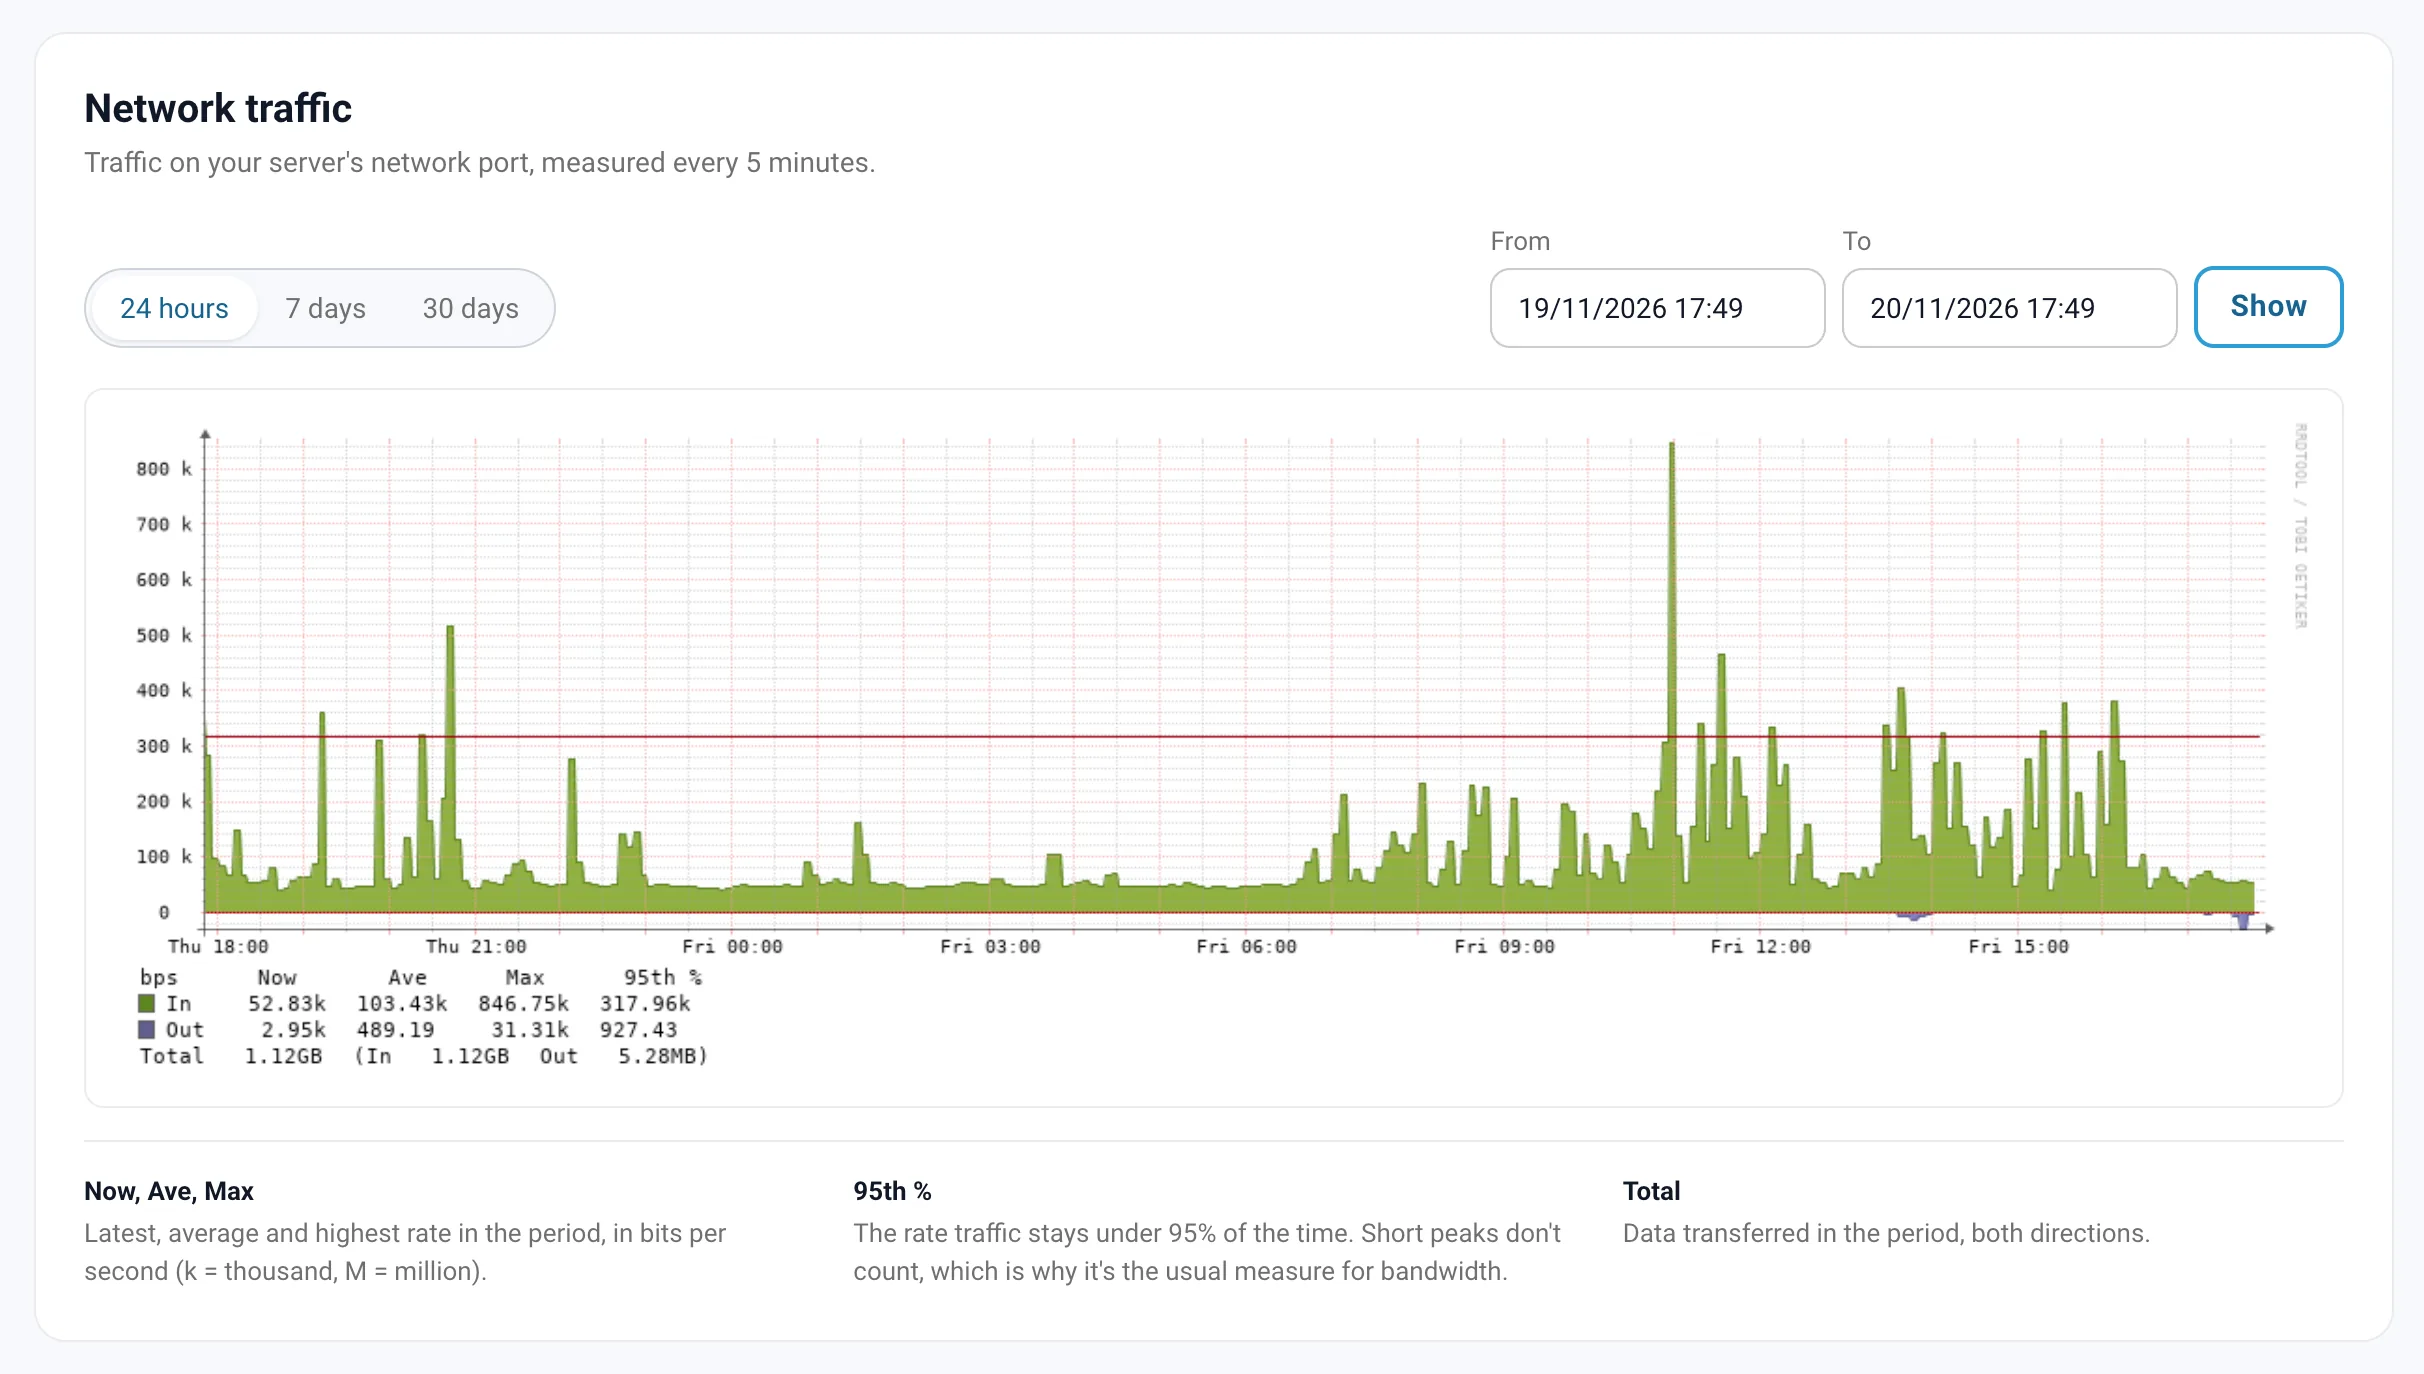
Read the graph
The graph is measured at our switch port, so In and Out are named from the switch's side:
| Label | What it is |
|---|---|
| In (green, above zero) | Traffic arriving at our switch from your server: what your server sends |
| Out (purple, below zero) | Traffic our switch sends to your server: what your server receives |
Under the graph:
| Value | Meaning |
|---|---|
| Now, Ave, Max | Latest, average and highest rate in the period, in bits per second (k = thousand, M = million, G = billion) |
| 95th % | The rate traffic stays under 95% of the time. Short peaks don't count. The red line on the graph marks it. |
| Total | Data transferred in the period, both directions |
| Port Speed | The speed of your switch port, for example 1 Gbps |
The graph lets you follow your traffic. Your plan's bandwidth is the one in your order.
Gaps and empty stretches
- A short gap of a few minutes means we missed a reading. It doesn't mean your server was down.
- The history starts when we began measuring your port, so a 7- or 30-day view can begin with an empty stretch.
- If the graph doesn't load, try again in a few minutes. If it keeps failing, open a ticket.
"No traffic graph yet"
Our team links each server's switch port to its graph. If the Graphs tab says No traffic graph yet, or you don't see a Graphs tab, open a ticket and we'll set it up. Equipment that shares a cabinet link with other equipment has no port of its own, so we can't show a separate graph for it.